Excel for Pharmacists: How Excel is used by healthcare organizations
Excel is one of the most powerful tools healthcare organizations have to understand and visualize the data they need to improve the care of the patients they serve. Outside of the accounting and revenue cycle departments, it is used in two broad ways: as a data analytics tool and as a project management tool. In this post, we’ll dive deeper into the data analytics side of Excel.
Virtually all electronic medical records, as well as automated medication systems, allow the user to download reports in Excel format, or at least some transformation of data into this more utilized format.
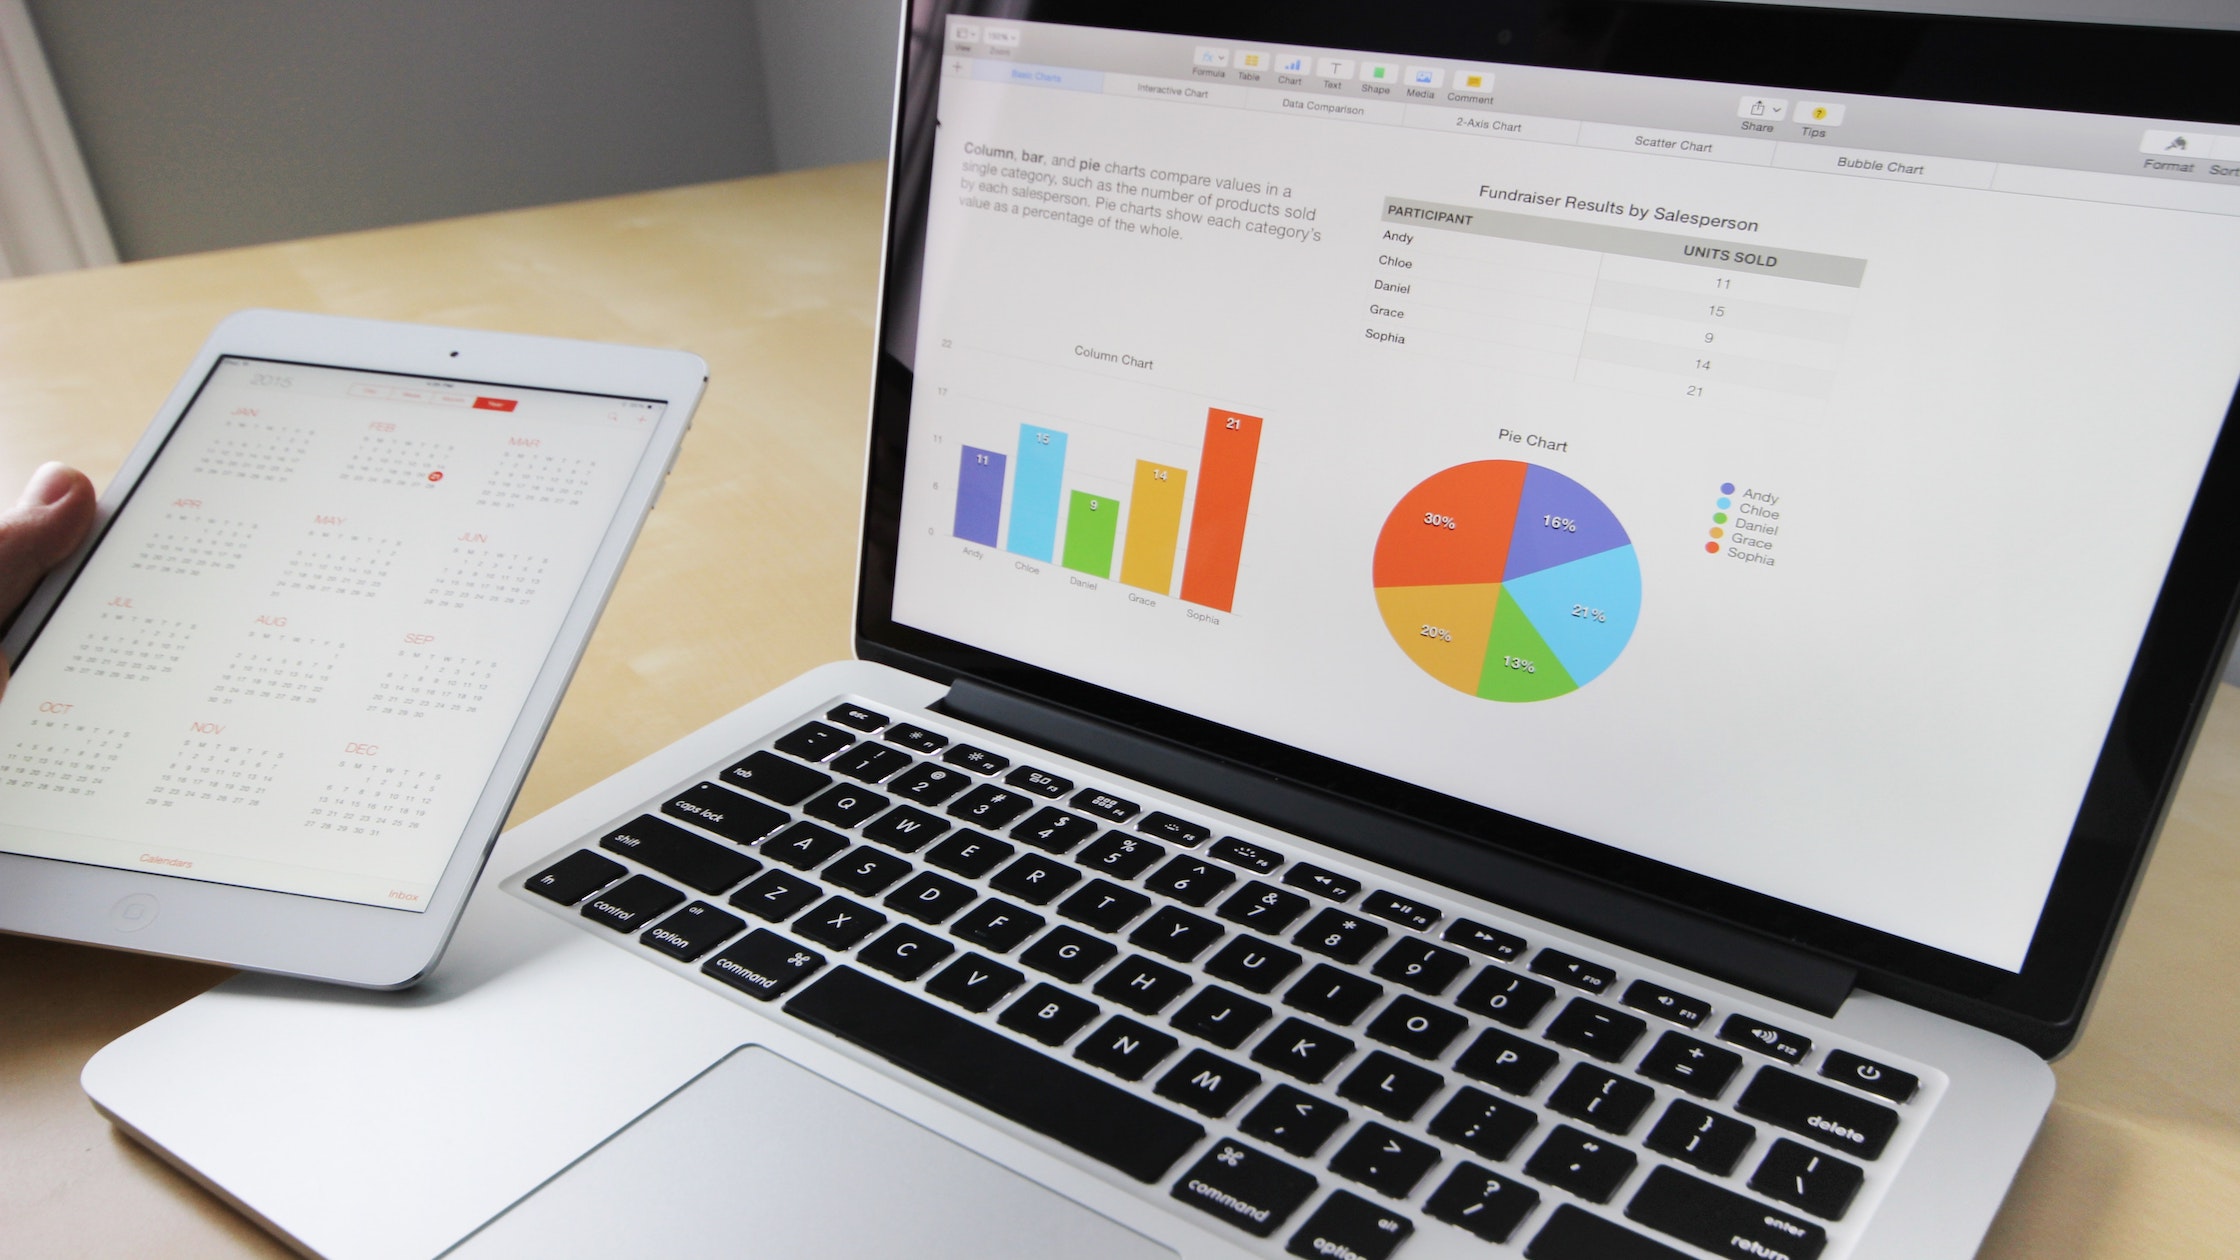
Excel, unlike other formats, enables the user to sort the data, eliminate unnecessary data, filter by categories or variables, and create charts and graphs that can then be put into presentations and shared with decision-makers. For those who know how to wield its powers, Excel is even able to help you compare multiple datasets from many different systems. This is where knowledge of the medication use process and data skills can uncover solutions to complex problems across the enterprise.

A Case Study…
To illustrate this concept, let’s look at a hypothetical scenario, not unlike many of the problems I have faced in my career.
Your pharmacy is trying to decide whether or not to open on Sunday. It is currently closed, but you are hearing anecdotally from the urgent care clinic next door of patients needing to get prescriptions filled that day.
Step 1- Determine gross margin and capture rate
First, using data from the clinic and from your pharmacy determine what percentage of their prescriptions your pharmacy is filling (i.e. your capture rate).
Afterward, using your pharmacy data, calculate an average gross margin for each prescription sent from the clinic. Because it is unlikely urgent care would write for biologics or many branded medications, a total average gross margin would not accurately reflect the opportunity.
Step 2- Estimate the opportunity
Take the clinic’s total Sunday prescription volume and multiply it by your capture rate to estimate how many prescriptions from the clinic you might fill if you were open. Then, multiply that by your average gross margin per prescription to estimate the total Sunday gross revenue.
While it is likely you would fill other walk-in prescriptions on Sunday, for this example we are only looking at the opportunity from the clinic. Also, although most pharmacies would refill regular medications on Sunday, which would make Mondays easier, those prescriptions would have been filled anyway so should not be included in the revenue opportunity for Sunday.
Step 3- Decide on optimal hours based on the data
If you decide to open on Sundays, the next step is to decide what hours to open. Create a bar chart of the clinic’s prescription volume by time of day, in one-hour increments, so you can visualize when the highest volumes are. Using this data, and speaking with clinic staff, can help you decide what hours make the most sense for the pharmacy.
How can you get started?
It took a significant amount of time to learn, apply and repeat the process over time, which worked to achieve the expertise. However, if you want to take advantage of saving the frustration I experienced on top of the hours spent, then sign up for my course Excel Fundamentals for Healthcare and get started learning Excel today!
Reviewed by the Pharmacy Informatics Academy team. If you would like to share your career perspective in pharmacy informatics or healthcare technology, shoot us a note!

